Hello RLY Community,
As you may recall, I was engaged by the RLY community last year to develop liquidity growth strategies for the Rally network. Through my project term, I engaged with numerous partners, worked with a variety of markets, and gathered significant information and insights on liquidity trends in the markets, and I’m pleased to share them with you here.
The core of this report will focus on key metrics and attributes of RLY liquidity during Q3 and Q4 of 2021. In order to assess liquidity health we will be looking at volume, volatility, and spread on a quarter-on-quarter basis. Additionally, we’ll look at RLY’s volume performance in comparison to the broader market using ETH’s volume metrics as a proxy. Lastly, we’ll go over some housekeeping items around the remaining budget, as well as some on-going engagements which should be concluding soon.
Volume
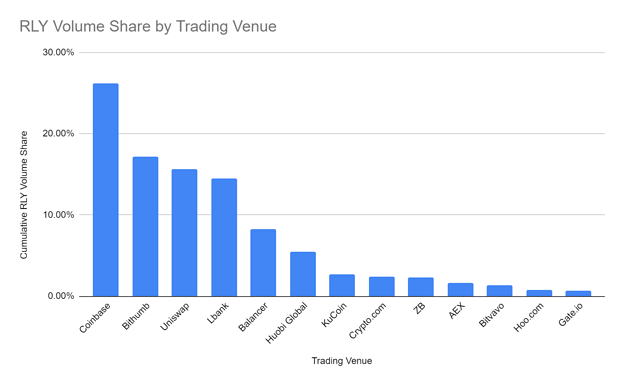
The most intuitive measure of liquidity tends to be volume. After all, it stands to reason that if something trades more, it’s more liquid, and generally, that’s roughly right. We certainly have seenvolume temporarily increase because of short term volatility only to come back down once things calmed down. We’ve also witnessed wash trading, and even at times completely phantom volume, create the appearance of liquidity for months at a time. We’ll touch on volatility later in the report, but with respect to the integrity of volume numbers, in crypto it really helps to be on well-run and respected liquidity pools. Fortunately in the case of RLY, more than 90% of its volume trades on venues where there is little lack of confidence in that respect. On both Coingecko.com and Coinmarketcap.com the following exchanges have at least a “Moderate” confidence score and most score much higher.
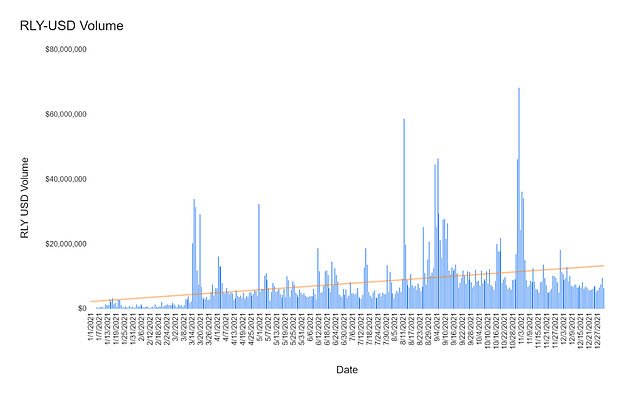
So now that we can have faith that the volume numbers we’re analyzing are trustworthy, let’s take a look at two ways of measuring volume and how RLY did in Q3 and Q4 with respect to both. Below is a chart of daily RLY volume measured in dollars along with an interpolated linear trend line. As is clear, from the beginning of the year until the end of the year, volume increased relatively consistently. In fact, if we compare total volume traded in Q1 versus that of Q4, we see that total Q1 volume measured in dollars was $267M, while by Q4 it grew to $978M, an increase of 267%. On its own, this is encouraging but when compared to ETH’s volume, which we’ll do below, it’s really quite impressive.
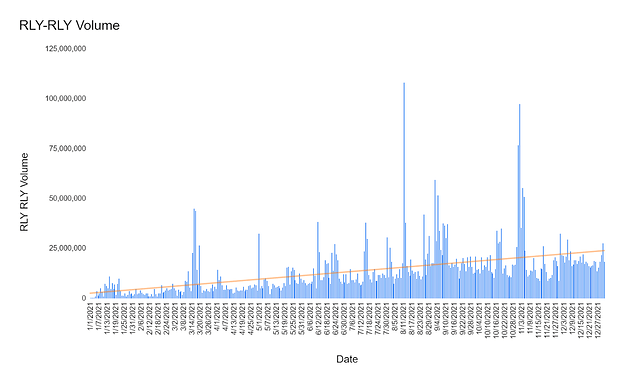
While the above is helpful, sometimes anchoring on USD volume traded for a token can be misleading when considering market liquidity health. As an example, which scenario is representative of a more liquid market, one in which a token is worth $1 and trades 1M times, or one where the token is worth $1M and trades once? In both instances there is $1M worth of volume, but if we define liquidity as the ability to sell or buy units of that token, then the former would be certainly considered more liquid. We do have to be a little careful here as measuring liquidity health on a unit basis is not infallible. After all, if a token is worth $0.0000001 and trades $1 worth of volume, a million units change hands. That said, it’s important to look at both to get a clearer picture of the liquidity health of a market.
Fortunately, the chart above shows that RLY volume measured by the amount of tokens traded increased at an even more pronounced rate than its USD volume growth rate. Clear uptrends in both measures are a significant indication of growing and improving market liquidity.
Now if we look at a quarterly comparison of the two volume measures we see an interesting picture emerge. In the beginning of the year, USD volume grew at a much larger pace, primarily driven by the price spike in March. But as the year progressed the market settled into a range, more exchanges listed RLY and market making liquidity grew, allowing for more and more RLY to change hands. As the price declined in Q4, we saw a divergence between the two measures. USD volume shrank slightly (-3%), but RLY unit volume growth grew (9%). Intuitively, this makes much sense. Given RLY’s price decreased almost 34% QoQ, we should expect volume in USD terms to decrease, and they did. However, it was a small 3% contraction in comparison. That contraction difference is reflected in RLY’s unit volume growth of 9%. In short, increased trading activity in RLY was enough to stem the notional volume decline.
| QoQ % Change | Q2/Q1 | Q3/Q2 | Q4/Q3 |
|---|---|---|---|
| Volume ($) | 123% | 69% | -3% |
| Volume (RLY) | 75% | 98% | 9% |
RLY’s volume picture comes into more focus if we take a look at its volume compared to that of ETH. As mentioned above, RLY’s USD volume grew 266% from Q1 to Q4. Over that same period, ETH’s USD volume shrank by 62.5%. Now there could be some mitigating factors here. As an example, migration of ETH volumes to OTC venues or derivatives liquidity pools which aren’t captured in reported spot volumes could possibly skew the numbers. Also, RLY and ETH are at different stages in their liquidity maturation process. However, given RLY is an ERC-20 token and ETH is the non-BTC bellwether, it’s still useful to compare the two.
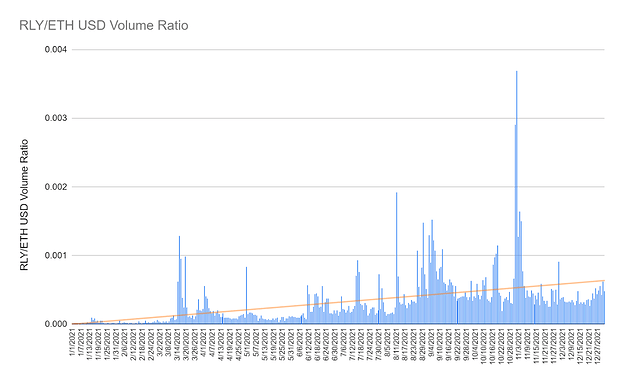
The chart below gives the full year picture of the ratio of RLY traded to ETH traded in USD terms. Throughout 2021 a clear trend emerged. In short, RLY volumes outpaced ETH volumes. It still has a long way to go before it eclipses ETH in terms of daily spot volumes, but RLY is headed in the right direction.
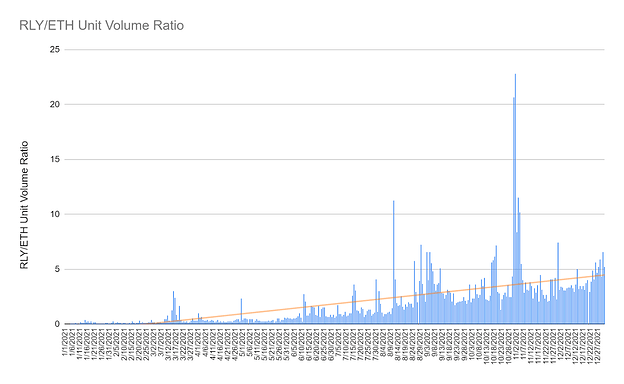
Similarly, when we look at unit volume traded we see an even more pronounced uptrend in the RLY/ETH volume ratio. Comparing Q1 to Q4, RLY unit volume increased by 277% while ETH unit volume shrank by 87%. One large caveat here is the fact ETH appreciated significantly in the second half of 2021. That said, given the incredible 2021 interest in ETH, it is impressive to see RLY volume do so well relatively.
Volatility
One of the most important indications of market liquidity development and growth is volatility. As liquidity for an asset develops, and hopefully grows, asset volatility should decrease accordingly. The largest market in finance, foreign exchange, which trades ~$7 trillion a day in volume, is one of the least volatile markets in the world. As an example, EUR/USD, euros vs dollars, trades about $1 trillion per day and has an annual volatility of about 5.5%. By comparison, the SP500 index has an annual volatility of 19%, and its underlying components trade approximately $250 billion a day. Intuitively this should make sense. If a market has more volume, it should be harder to influence the price of that market. More activity should mean that it’s less likely one trade, unless it is very large, could materially impact the price.
As an aside, FX is the most liquid market in the world not because of speculation, which is often cited as a primary driver of its liquidity. Instead, the liquidity of the FX markets is driven by real commerce that flows every day through FX markets all over the world. FX is the largest market in the world because people and commerce need to transact in it irrespective of price. Every day a car parts manufacturer in Japan receives payments in EUR or USD and has to swap those out for JPY in order to pay rent and payroll in Japan. This is something often lost in the shuffle of market analysis, particularly in crypto: non-speculative flow is the holy grail of market development.
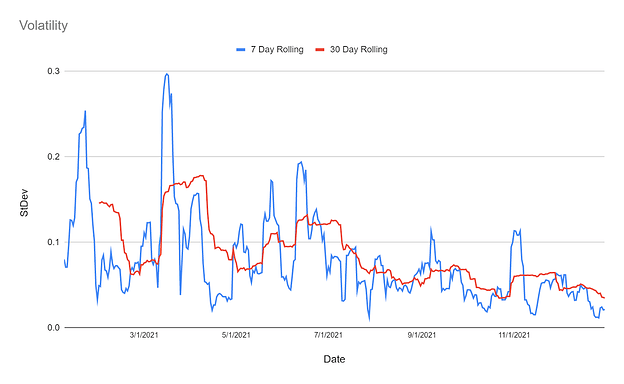
As is evident from the chart above, RLY volatility consistently trended lower in 2021. That should not be too surprising since it is a newer token. Lower liquidity often begets more volatility, and that was evident in the beginning of the year. However, as the year progressed and liquidity improved, we saw a clear trend emerge, one that was actually somewhat dramatic: sharp quarter on quarter drops in volatility through 2021.
| QoQ % Change | Q2/Q1 | Q3/Q2 | Q4/Q3 |
|---|---|---|---|
| RLY QTR Volatility | -25.9% | -36.6% | -24.9% |
Clearly from the table we see that quarterly volatility had a striking decline throughout the year. But before we begin to think maybe things are headed towards FX levels of calmness, it’s probably good to recognize RLY still ended the year with an annualized volatility of 180%. Clearly there is still a little room for development.
One quick note, the measurement here is the standard deviation of log normal daily returns for the time period specified. In short, volatility measured is not annualized. The chart above is a graph of 7 day and 30 day rolling volatility and in the table it’s a fixed quarterly measure.
Spread
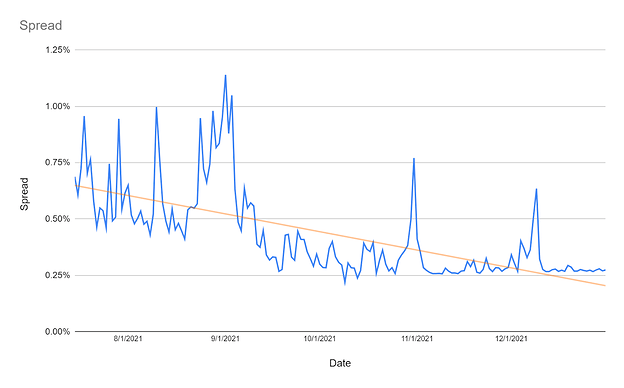
Lastly, and possibly the most important liquidity metric we have for proving out market health, we’re going to take a look at spread. For clarity, what we have above is charted data for the top of the RLY/USD order book at Coinbase. This represents the average daily price difference between the best bid and the best offer on that order book. We obtained this data from our market makers who began providing liquidity on this book in the middle of July of 2022. Unfortunately, we don’t have any data for periods before the middle of July, but the trend here is clear regardless. As market liquidity improved, particularly in the last quarter of the year, spreads tightened considerably and seemed to bottom out near 25 basis points. This tells us one thing which is particularly important. Throughout the year, the market became increasingly comfortable in providing RLY liquidity at improved rates. Some of this is undoubtedly driven by the activity of market makers we work with, but they were under no obligation to bring spreads to these levels. They did so, however, because there was enough liquidity to safely do so, and that’s a very good sign indeed.
Housekeeping
Lastly, I wanted to give the community an update on the budget, how much currently remains from engagements begun in 2021, and where we expect things to end up this year.
| Budget | Used | Committed | Loans | Remaining | |
|---|---|---|---|---|---|
| RLY | 65,000,000 | 14,600,987 | 15,075,000 | 21,133,000 | 14,191,013 |
| USDC | 5,000,000 | 50,000 | 0 | 500,000 | 4,450,000 |
At the moment we have used or have committed roughly 30M RLY and have 21M in outstanding loans. The bulk of those loans are due to be repaid in the second half of 2022. In essence, of the total budget, we will have spent about 29M RLY and 50,000 USDC. That spend was instrumental in building liquidity and awareness on 11 exchanges and with four market makers. That said, there is still much to do.
Though my engagement with the community concluded at the end of 2021, I will continue to work with the RLY Network Association to ensure the completion of ongoing engagements, as well as help with new liquidity growth initiatives. This will likely include expanding RLY liquidity to multiple layer one and layer two scaling protocols. Additionally, as the association continues to establish its operational footprint, there will be an opportunity to assist in its treasury management strategies and procedures. As said, there is much work to be done, and I Iook forward to helping in any way I can.
Lastly, I just wanted to thank everyone in the community who helped get so much of this done. As with all good work, it’s always a team effort, and that was certainly the case here. The process was not without its challenges, but I think there is much to be proud of. Thank you for all the help and I look forward to continuing to be part of this community, in whatever capacity, for a long time to come.
